By Paul Quigg, columnist
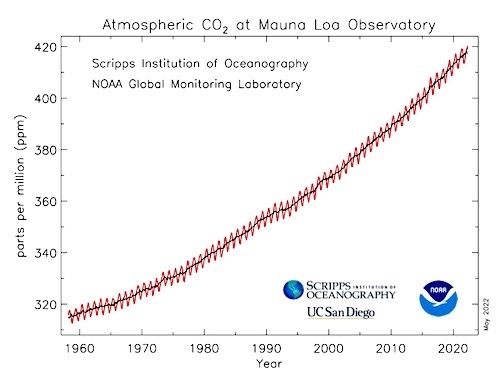
The graph above from the National Atmospheric and Oceanic Agency, a division of the Department of Energy shows the accumulation of atmospheric CO2 at Mauna Loa Observatory in the Hawaiian Islands. This remote location in the middle of the Pacific Ocean gives a very clear and accurate reading of the CO2 accumulation from the late 1950’s to 2021. The graph shows a steady and slowly accelerating rise in CO2.
The continuing rise is very discouraging in light of all of the global efforts to reduce CO2 accumulations. When we consider all of the time and money we have spent over the years we are faced with the reality that the task is far greater than we realize. This reality can not be rationalized away and it can not be explained away. It is a fact which must be incorporated into the solution to this warming problem.
It is quite clear that rising CO2 accumulations in the atmosphere are causing the global temperature to rise, as it is also quite clear that present efforts are inadequate, and in my estimation the global community will not make the needed sacrifice to significantly address the problem. Goals are set, promises are made, and results are far in the future. Past goals have all quietly failed to come close and few have shown any reduced emissions. Presently 1.5 percent of U.S. energy is produced by solar energy, the global percentage is about the same.
Quantifying CO2 emissions is next to impossible as smokestacks, trees, wetlands and other emitters and storers are impossible to monitor. Every jurisdiction sets their own parameters for emissions and truthfulness is seldom given a high priority. Forests, which have been there for hundreds of years, suddenly become great stores of carbon as if they hadn’t been before. Nothing has changed, but suddenly they are storing vast amounts of carbon. Everyone knows it’s a bunch of crap, but they are all in the same game.
The dis-information in the renewable energy sector is beyond belief as opportunists take advantage of huge tax breaks and subsidies while producing vast amounts of CO2 in the guise of being “Green.” Bio-fuels, which are basically our trash, are burned and get credits because it is renewable, even as it is one of the most carbon intensive fuels.
Everyone is guilty and CO2 continues to rise faster and faster.
Mr. Quigg, a University of Virginia graduate and resident of Luray, has practiced architecture in the Mid-Atlantic region since 1962. As a lifelong environmentalist, in the 70’s he was appalled at the polluted air and water and has dedicated much of his time since in studying and commenting on the environment. He has been published in the Washington Post, the Wall Street Journal and other publications.
•••
RELATED ARTICLES
Tomorrow ~ Warmer weather is not a bad thing
Tomorrow ~ Without subsidies, solar industry would dry up
Tomorrow ~ Thank you planning commission
Planning commission recommends denial of Cape Solar application by unanimous vote
New moratorium placed on future solar farm applications after Cape Solar mix up
Vaughan submits two late motions to waive moratorium on Cape Solar application


How much CO2 is safe in the atmosphere?
5,000 parts per million
OSHA has established a Permissible Exposure Limit (PEL) for CO2 of 5,000 parts per million (ppm) (0.5% CO2 in air) averaged over an 8-hour work day (time-weighted average orTWA.)
https://www.fsis.usda.gov › media_file
In terms of the safety of CO2 regarding climate, well, inhalation by people isn’t part of the discussion.
So according to your deceptive chart, if you look closely, in about 60 years, CO2 didn’t really rise that much.
Long way to go to 5000ppm. About 3000 years time to get there.
With the DEMONcrats in control, price inflation, and illegals soaking up electric power with AC and laundromats, is a bigger threat.
Robert, It is not my deceptive chart, it’s the work of the US Dept. of Energy. The problem is that it is predicted that a doubling of CO2 levels from pre-industrial levels of 260ppm to 560ppm will cause a temperature rise of 2 degrees Celcius. The air in submarines contains several thousand ppm of CO2.
Paul, when I saw the word ‘discouraging’ in the title, I interpreted that to mean you bewail the rise in CO2. I had not yet read your previous column, in which you say that warming has a good side to balance the bad. Now I get it that you’re discouraged that for all the great efforts that have been made to lower emissions, the trajectory of emissions is unchanged. So why bother with continuing, when there is a risk to the economy? Is that a fair reading Of your position?
What I’d question is whether our efforts have really been all that significant, worldwide. We aren’t anywhere close to the point of being able to say we’ve done all we could. ‘Actions’ have largely been promises that are then broken, as you mentioned. It’s no surprise, then, that the chart looks as it does. The futility of trying to bring down CO2 concentrations hasn’t been demonstrated.
I see from the U.S. E.I.A. that solar accounts for 2.8% of electricity generation. That’s about double the figure you used, though still far from major player status.