
Year-to-date rainfall close to average, temperatures rising
By Carl Quintrell, weather correspondent
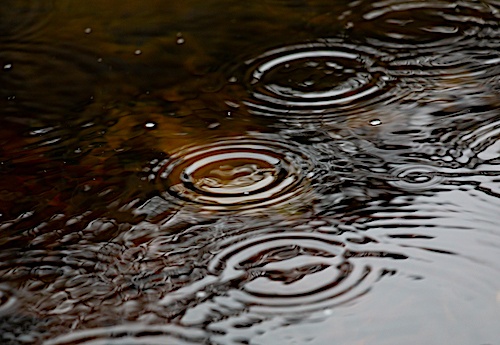
STANLEY — Total rainfall for the month finished slightly above average at 3.57 inches, or 0.43 inch above the October average of 3.14 inches. The Page Valley received 2.48 inches of that rain from the remnants of “Isaias” on Oct. 10–12.
No rain was recorded during the second half of the month (Oct. 16–31).
The calendar year-to-date rainfall is now 34.32 inches, or 0.14 inch below average.
The driest October was in 2003, with only 0.06 inch of rain recorded. The wettest October was 1972, with 9.37 inches of rain (including 7.05 inches recorded on Oct. 5 and 6, 1972).
Temperatures climbed slightly during the month of October. The average mean temperature was 59.1 degrees, which is above the 58-year average of 56.5 degrees. The average daily high temperature was 71.1 degrees. The 58-year average daily high is 67.3 degrees. High temperatures climbed above the 80-degree mark on five days, the 70s on nine days, the 60s on 15 days and only into the 50s on two during the month.
The high for the month was 88 degrees on Oct. 2. The warmest October on record was in 2007 and 2017, where the average daily high temperature was 73.2 degrees.
The average daily low temperature for the month was 47.1 degrees. The 58-year average daily low temperature is 45.7 degrees. Low temperatures for the month were down into the 30s on eight days, the 40s on 10 days, the 50s on 10 days and in the 60s on three days during the month.
The low for the month was 33 degrees on Oct. 19. The coolest October on record was in 1988, where the average daily high temperature was only 61 degrees.
The peak wind gust for the month was 39 mph recorded on Oct. 16
Weather Records broken during the month of October 2026:
• Oct. 11 — Single Day Rainfall of 2.25 inches; previous record of 1.61 inches in 1990.
• Oct. 13 — High Temperature of 84 degrees; previous record of 82 degrees in 1970.
• Oct. 14 — High Temperature of 88 degrees; previous record of 87 degrees in 1975.
Other statistics for the month:
• 25 clear to partly cloudy days (20 avg.)
• Six cloudy to mostly cloudy days (11 avg.)
• 22 days with dew (17 avg.)
• Six days with frost (four avg.)
• Three days with fog (three avg.)
• No days with a thundershower (one avg.)
For more local weather information,
•••
RELATED WEATHER ARTICLES
Virginia corn harvest exceeding expectations after drought-stressed start
September proves to be driest month of 2026
Virginia corn growers urged to stay vigilant against emerging fungal disease
State of emergency declared to help farmers affected by statewide hay shortage
August produces nearly six inches of rain
Additional 40 Virginia localities receive USDA drought disaster designations
Rainfall down, temperatures up in July
Fifty-nine Virginia counties designated natural disaster areas; eligible for assistance
NWS reports five tornadoes hit region on July 21
Microburst generated winds up to 85 mph on June 22
Below average rainfall for June
Above average rainfall for May
Warmest April in last 58 years
Higher temperatures, less rain and snow in March

Be the first to comment